── Attaching packages ─────────────────────────────────────── tidyverse 1.3.2 ──
✔ ggplot2 3.3.6     ✔ purrr   0.3.4
✔ tibble  3.1.8     ✔ dplyr   1.0.9
✔ tidyr   1.2.0     ✔ stringr 1.4.1
✔ readr   2.1.2     ✔ forcats 0.5.2
── Conflicts ────────────────────────────────────────── tidyverse_conflicts() ──
✖ dplyr::filter() masks stats::filter()
✖ dplyr::lag()    masks stats::lag()
New names:
    HPI rank        Country              ISO                ...4
 Min.   :  1.00   Length:152         Length:152         Length:152
 1st Qu.: 38.75   Class :character   Class :character   Class :character
 Median : 76.50   Mode  :character   Mode  :character   Mode  :character
 Mean   : 76.50
 3rd Qu.:114.25
 Max.   :152.00
   Continent     Population (thousands) Life Expectancy (years)
 Min.   :1.000   Min.   :    299.9      Min.   :53.30
 1st Qu.:3.000   1st Qu.:   4970.4      1st Qu.:67.25
 Median :5.000   Median :  11521.8      Median :74.65
 Mean   :4.717   Mean   :  49738.8      Mean   :73.06
 3rd Qu.:7.000   3rd Qu.:  37530.2      3rd Qu.:78.62
 Max.   :8.000   Max.   :1433783.7      Max.   :84.90
 Ladder of life (Wellbeing) (0-10) Ecological Footprint (g ha)      HPI
 Min.   :2.375                     Min.   : 0.5157             Min.   :24.33
 1st Qu.:4.819                     1st Qu.: 1.5019             1st Qu.:39.32
 Median :5.526                     Median : 2.5710             Median :44.70
 Mean   :5.532                     Mean   : 3.3252             Mean   :44.55
 3rd Qu.:6.282                     3rd Qu.: 4.4461             3rd Qu.:50.87
 Max.   :7.780                     Max.   :15.0376             Max.   :62.06
 Biocapacity for year \r\n(g ha) GDP per capita ($)
 Min.   :1.56                    Length:152
 1st Qu.:1.56                    Class :character
 Median :1.56                    Mode  :character
 Mean   :1.56
 3rd Qu.:1.56
 Max.   :1.56
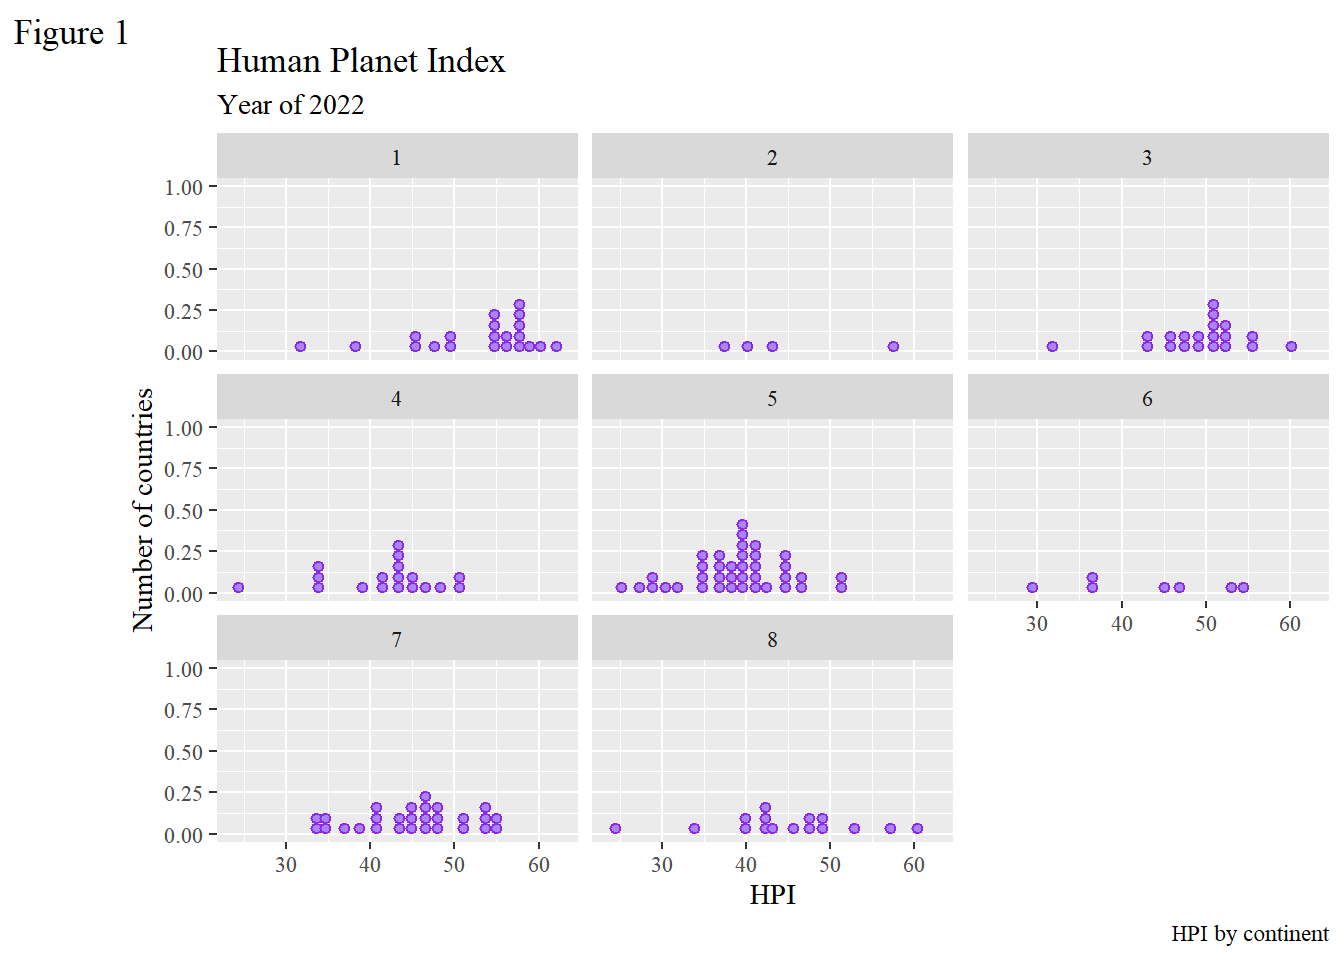
1. Table with Embedded Charts
Let’s use font ‘Times’ and colors ‘blueviolet’ and ‘mediumpurple1’.
Warning in class(hpi$gdp) = "double": NAs introduced by coercion
Bin width defaults to 1/30 of the range of the data. Pick better value with `binwidth`.
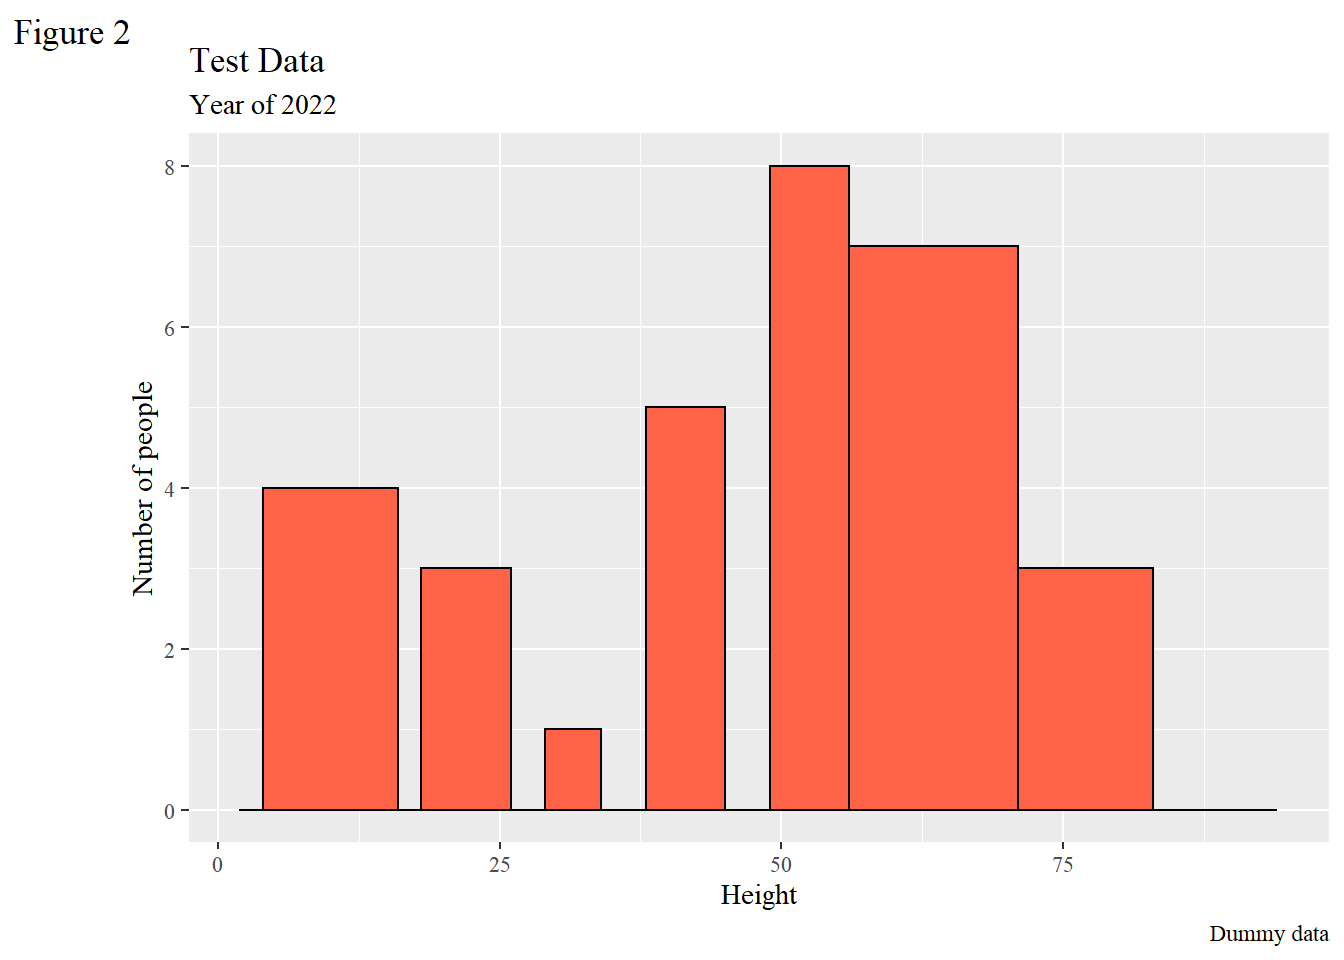
2. Variable Width Column Chart
Let’s use font ‘Times’ and colors ‘gray0’ and ‘tomato1’.
     height          weight
 Min.   : 10.0   Min.   : 2.00
 1st Qu.: 40.0   1st Qu.:28.00
 Median : 50.0   Median :47.00
 Mean   : 49.7   Mean   :52.39
 3rd Qu.: 70.0   3rd Qu.:84.00
 Max.   :100.0   Max.   :94.00
Synergy Report
Our team members worked collaboratively to produce these plots. The bar chart with varying widths was spearheaded by Vikrant and Namrta, and the facetted charts were primarily done by Eli and Seongdeok. Additionally, fonts were added by Vikrant, titles were added by Lizzie, Eli merged these additions with the main plot code, and Namrta had the idea to use simple custom data to aid in plot creation.